· performance · 9 min read
Spring Boot on the JVM vs GraalVM Native: What Actually Wins on AWS
A head-to-head benchmark of the same Spring Boot app built for the JVM and as a GraalVM native binary — on real AWS hardware with a real database, run multiple times. Native wins startup, memory, and predictability; the warm JVM wins the median, peak throughput, and often the tail too — but the JVM swings run-to-run while native stays flat.
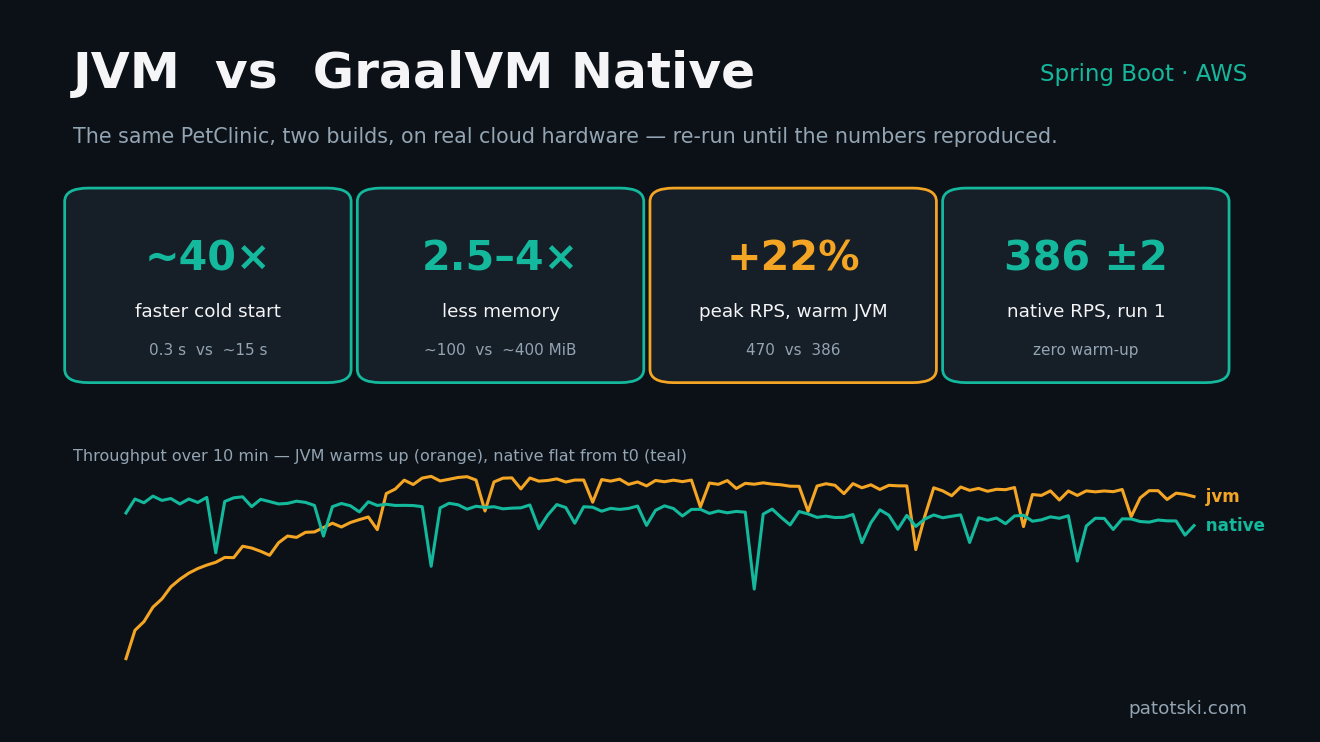
TL;DR — On a 2 vCPU / 4 GB AWS c7i.large with Postgres on a separate RDS db.t3.micro and k6 on its own EC2 (each result run multiple times):
- GraalVM native starts in ~0.3 s vs ~15 s — roughly 40× faster, measured from Spring Boot’s own startup log and steady across runs.
- The JVM, once warm, has a lower p50 (≈8–10 ms vs ≈18–20 ms native) and serves a few % more sustained RPS at moderate load.
- At saturation it depends on warm-up: a fully-warm JVM serves ~22 % more peak RPS (~470 vs ~386), but native hits its peak from the first request with near-zero run-to-run variance — the JVM’s first saturation burst is its worst.
- Native’s sustained tail is the predictable one (p99 ~150 ms every run; the warm JVM is often lower but swings 110–171 ms), and it uses ~2.5–4× less memory (≈100–165 MiB vs ≈390–420 MiB).
Stack: Spring Boot 4.0.3, Java 25 LTS, GraalVM Community 25, Postgres 18.3 on RDS, Ubuntu 24.04 LTS on EC2.
The question
JVM vs native benchmarks usually compare hello-world startup or fib(40). Real services have a database, Hibernate, Thymeleaf, the whole Spring lifecycle. So I took the canonical Spring sample — PetClinic — built it two ways, and put the same load on each on the same cloud hardware.
Two variants:
- JVM — Spring Boot fat JAR on Eclipse Temurin 25, default SerialGC.
- Native — GraalVM Community 25, default
nativeCompile.
Setup
| Component | Value |
|---|---|
| App | Spring Boot 4.0.3 + PetClinic (Thymeleaf + JPA) |
| Java | 25 LTS for both |
| Native compiler | GraalVM CE 25 (default nativeCompile) |
| Database | AWS RDS Postgres 18.3 (db.t3.micro) — separate instance |
| App host | EC2 c7i.large (2 vCPU, 4 GB, non-burstable) |
| Load host | EC2 c5.large (separate, runs k6 only) |
| Container limit | 1 CPU / 512 MB cgroup |
| Sustained load | k6 mixed workload, 50 VUs, 10 min, 4 scenarios (40/20/20/20) |
| Saturation load | k6 ramping-arrival-rate, 100 → 2000 req/s over 5 min |
| Cold start | container start → time until /actuator/health answers 200 |
Workload mix: GET /owners?lastName=Davis (40 %), GET /owners/{id} (20 %),
GET /vets JSON (20 %), POST /owners/new (20 %).
Why a separate load EC2 and a real RDS instead of running both in containers on the same host? Because the first run with everything on one EC2 had the JVM CPU sitting around 90 % and native at 100 % — that 10 % isn’t free, it’s the load generator stealing cycles. With k6 on its own 2 vCPU c5.large and Postgres on RDS, the app instance has its full 2 vCPU for handling requests. That’s how production deployments are shaped, and that’s what the numbers below describe.
A non-burstable instance matters too. t3.* and t4g.* accumulate CPU
credits that vanish under sustained load — you get the wrong numbers, and
you can read them as “native is slower” when the credit bucket simply ran
out mid-test. c7i.large holds full CPU the whole time.
Results
Sustained-load numbers are computed after dropping the first 60 s so the JVM’s JIT has finished its warm-up curve — otherwise the JVM numbers are unfairly low.
Sustained mixed workload (50 VUs, 10 min)
| Variant | RPS | p50 (ms) | p95 (ms) | p99 (ms) | Errors |
|---|---|---|---|---|---|
| JVM | 434 | 8 | 64 | 110 | 0 |
| Native | 396 | 18 | 69 | 152 | 0 |
The tail is the catch: across two runs the JVM’s p99 swung 110–171 ms while native’s barely moved (147–152 ms). This run the warm JVM had the lower tail; the previous run native did. Native’s tail is the predictable one, not reliably the lowest.
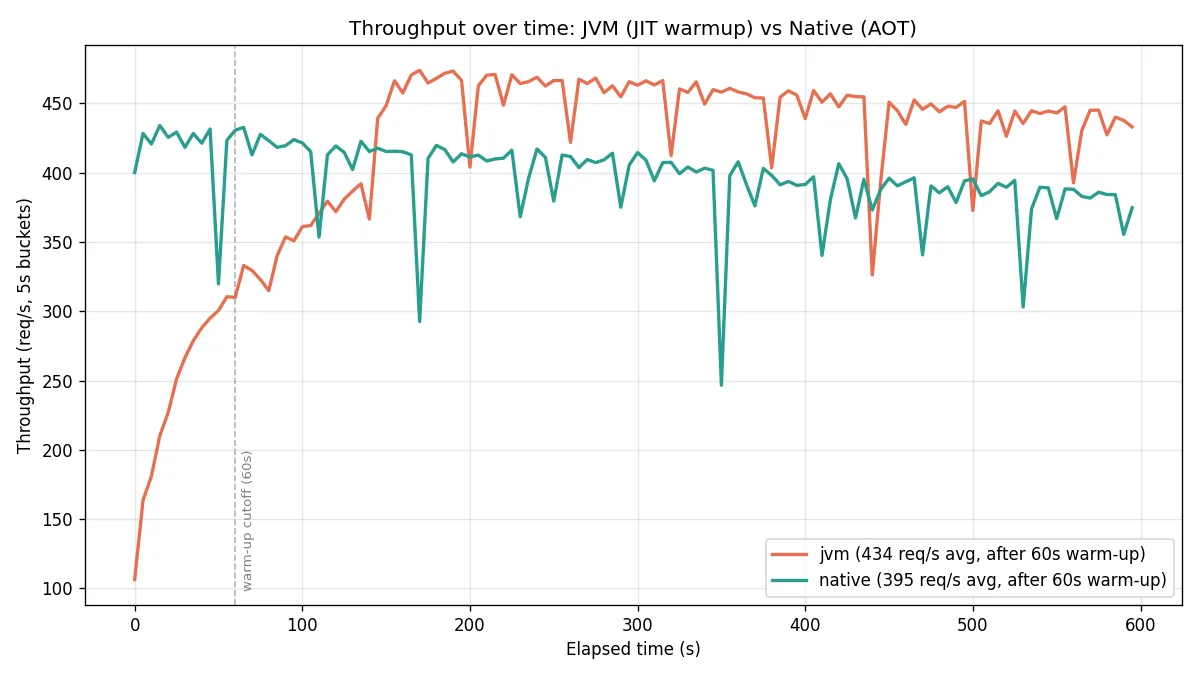
The periodic dips on both lines are SerialGC stop-the-world pauses (the default GC at this heap size, for native too): a sub-second freeze shows up as one low 5-second bucket and recovers in the next, with zero failed requests. G1 would smooth them out — at a higher memory cost, which is exactly the trade you don’t want on a memory-constrained container.
The JIT warm-up is visible in the orange line: JVM throughput ramps from ~100 req/s at boot to ~450 req/s after about two minutes. Native serves ~400 req/s from the first second. After warm-up, the JVM serves a bit more sustained throughput (434 vs 396, +10 %) on moderate load.
The hot-path p50 belongs to the JIT (8 ms vs 18 ms native): C2 has runtime profile data the AOT compiler doesn’t get, and PetClinic’s most-frequent path is small enough that it fits well in C2’s optimized form. The tail is subtler than I first thought: I originally wrote that native wins p95/p99 (no GC pauses), and in one run it did — but re-running showed the JVM’s tail swinging run-to-run while native’s stays flat. So the honest read is that native gives you a predictable tail, not a guaranteed-lower one; a warm JVM is often lower but rolls the dice on GC.
Peak-RPS saturation sweep (100 → 2000 req/s over 5 min)
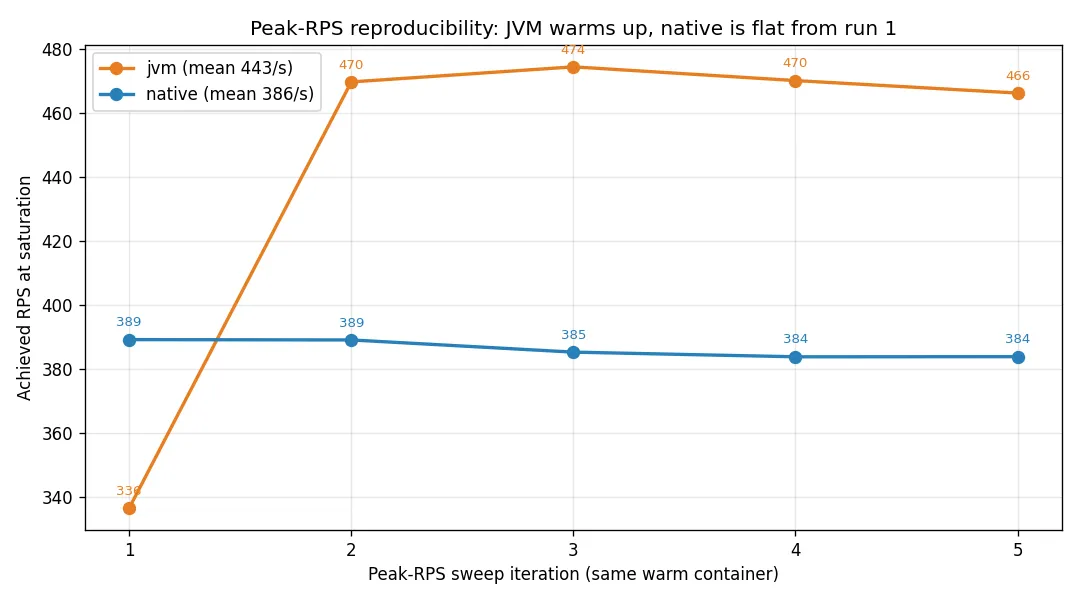
This is the number that fooled me first. A single peak sweep picked a different winner almost every run. So I ran the sweep five times back-to-back against the same warm container for each variant:
| Variant | Peak RPS | p50 | p95 | p99 | Errors |
|---|---|---|---|---|---|
| JVM (warm, runs 2–5) | ~470 | ~615 ms | ~2000 ms | ~2800 ms | 0 |
| JVM (run 1, cold) | 336 | 1109 ms | 3295 ms | 4823 ms | 0 |
| Native (all 5 runs) | 386 ± 2 | ~800 ms | ~2500 ms | ~3388 ms | 0 |
Two things jump out. First, once the JVM is fully warm it wins peak throughput by ~22 % (≈470 vs 386 RPS) at a lower median — C2 has had time to compile the hot path and the larger heap absorbs the burst. Second, native is boringly consistent: 386 RPS with a standard deviation of 2, identical from the very first request. The JVM’s first saturation burst is its worst run (336 RPS, p99 4.8 s) — even after a warm-up loop — and its warm ceiling still drifts run to run.
So “who wins peak” is the wrong question. The JVM has the higher ceiling once warm; native gives you the same predictable number every time with no warm-up window. Neither variant returned a single 5xx — k6 just queued requests as latency grew.
The autoscaling angle (where the per-instance loss can flip on cost)
That ~470-vs-386 win is a single-instance number. In an autoscaled fleet the economics can invert. Native starts in ~0.3 s and uses 2.5–4× less memory, which means you can: pack more replicas per node when memory is the binding limit, drop the warm-pool over-provisioning you need to hide 15 s JVM starts, and scale out in lockstep with traffic instead of minutes behind it. For the same monthly spend you can often run more small native replicas — and more aggregate, predictable throughput — than a handful of larger JVM boxes, even though each JVM box wins head-to-head when warm.
Two honest caveats. First, I didn’t benchmark a full autoscaled fleet — this is the implication of the startup + memory numbers, not a measured fleet result. Second, the per-dollar win comes from right-sizing on memory, and you usually can do it without giving up cores: at a fixed 2 vCPU you can drop from a memory-heavy family (r7i.large 16 GB, m7i.large 8 GB) down to c7i.large (4 GB) — same two cores, lower bill — or bin-pack many more native containers per node. What native doesn’t do is conjure free CPU: here the 2 vCPU saturated long before the ~120 MiB of RAM mattered, so a genuinely smaller instance with fewer cores would serve less. Native shrinks the memory bill at equal CPU; it doesn’t hand you more cores for free.
Startup
Measured straight from Spring Boot’s own Started … in X seconds (process running for Y) log line — no health-poll quantisation:
| Metric | JVM | Native |
|---|---|---|
| Spring “Started in” | 14–17 s | 0.30–0.39 s |
| Process exec → ready | 16–18 s | 0.36–0.39 s |
Native boots roughly 40–50× faster, and the figure is rock-steady across runs. If you’re paying for over-provisioned warm pools to hide JVM startup, native lets you drop them.
(An earlier draft of this post quoted native at 1.16 s. That was a 1-second health-poll rounding a sub-second boot up to the next tick — exactly the kind of measurement artifact a benchmark should catch. Spring’s own log says ~0.3 s.)
Memory and image size
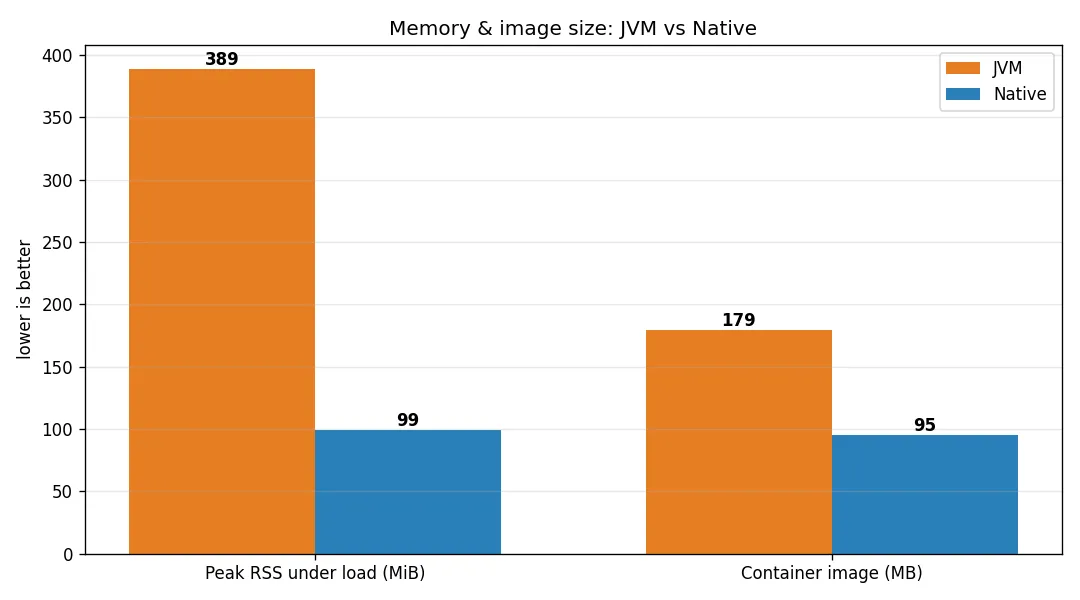
JVM peak RSS lands around 390–420 MiB under load, native around 100–165 MiB — 2.5–4× less memory (it varies run to run; native is always far lower). The JVM container image is ~180 MB, native ~95 MB — about half. On 4 GB instances the absolute number is small, but on bin-packed nodes (k8s, Fargate) it means more replicas per host.
What the numbers don’t show
- Native build time. ~5 min for the native image vs seconds for the JVM build. Tolerable for CI, painful for the inner dev loop. Use the JVM build while iterating locally; ship the native one.
- AOT-maturity tax. Reachability hints, runtime reflection
registrations,
--initialize-at-build-timebattles — they happen at build time, but they happen. PetClinic itself shipped a bug:RuntimeHints.resources().registerPattern("db/*")only matches files directly indb/, notdb/postgres/schema.sql. The native image passed/actuator/healthand then 500’d every business endpoint until I patched it todb/*/*.
When to switch
If your service:
- runs in a serverless / scale-from-zero environment (Lambda, Fargate, Knative)
- sees bursty, occasional, or low traffic — the JVM’s JIT never gets enough sustained work to reach its warm advantage, so it lives on its slower cold curve anyway
- needs tight memory budgets for density
- needs a predictable tail (low variance) more than the lowest median
- needs predictable performance from the first request (no warm-up window)
…then native pays for itself in startup time and predictability.
If your service:
- runs as long-lived workers with stable load and warm pools
- relies on heavy reflection / dynamic class loading you can’t easily annotate
- doesn’t have p99 SLOs
…stay on the JVM. You’ll get the lower median, the higher warm-throughput ceiling, and you avoid the AOT tax.
How to run this yourself
Repo: https://github.com/xp-vit/spring-petclinic
# Local (Docker only)
./benchmark/scripts/run-local.sh standard all     # jvm + native

# AWS architecture (2 EC2 + RDS)
AWS_PROFILE=<your_profile> ./benchmark/scripts/benchmark-v2.sh
The terraform tears everything down at the end. Cost per AWS run is a few cents for ~70 min including RDS.
Running a Spring Boot service that’s outgrowing its instance size? Book a free 30-minute call and I’ll look at where native — or just better JVM tuning — would actually move your bill and your latency. Or grab the free AWS checklist to find quick wins on your own.