 Viktar Patotski ·
· Performance
· 9 min read
Viktar Patotski ·
· Performance
· 9 min read
Graviton vs Intel vs AMD: I Measured the Price-Performance on a Real Spring App
AWS says Graviton gives up to 40 percent better price-performance. I put the same Spring app on same-rank Intel, AMD, and Graviton instances and measured it. It is true, I got 43 to 60 percent, but the reason is not that Graviton is faster. It is cheaper, and same vCPU does not mean same cores.
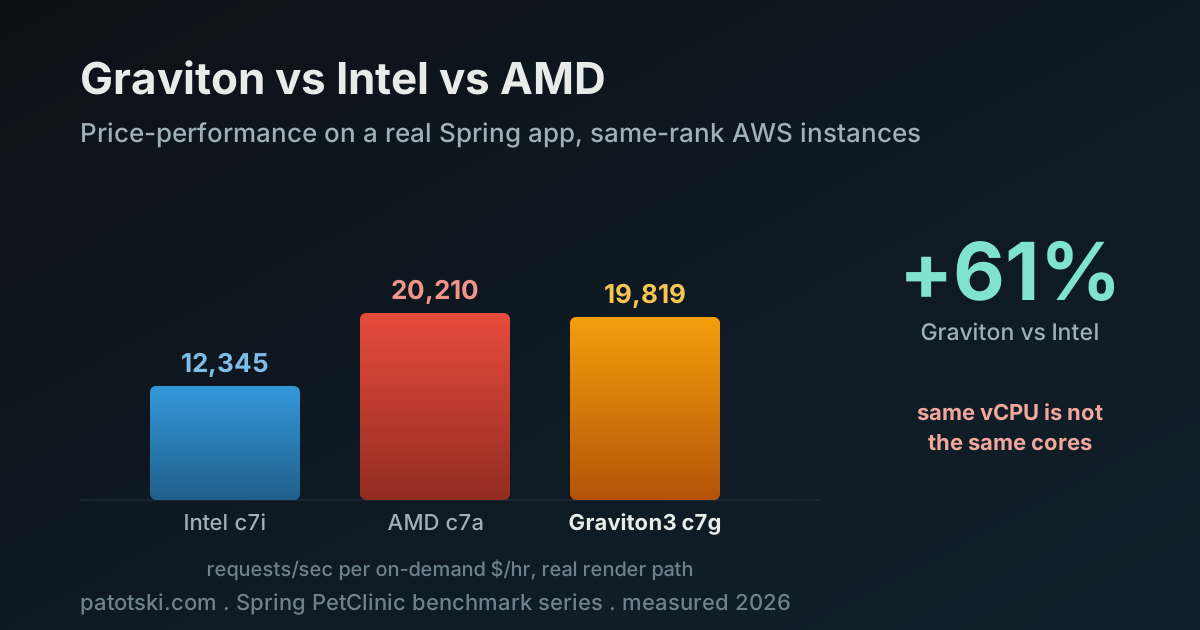
TL;DR - Same Spring app, one multi-arch container, same-rank
c7.large(2 vCPU / 4 GB) on Intel (c7i), AMD (c7a), and Graviton3 (c7g), under CPU-bound load. Requests per second per on-demand dollar per hour:
- Graviton3 wins price-performance: +43% synthetic, +60% on the real render path versus Intel. It beats AWS’s own “up to 40%” claim on this workload.
- AMD ties Graviton per dollar (+40% / +64%) and has the fastest single core, but it is the most expensive per hour so the dollar math evens out.
- The twist: same 2 vCPU is not the same 2 cores. Intel hyper-threads (2 vCPU = 1 physical core), AMD and Graviton give 2 real cores. Most of Intel’s deficit is core count, not slow silicon.
- Graviton wins by being cheapest, not fastest. Weakest per core, two real cores, lowest price per hour.
- The catch: tail latency does not follow the price win. At a matched 100 concurrent, Graviton’s p99 was worst on the synthetic path (603 ms), while on the real path Intel was worst (192 ms) and AMD best (139 ms). Measure your own.
All JVM, so the ARM move was a non-issue. The economic comparison is per vCPU-hour, which is what you actually rent.
The claim, and why I did not trust it
Open the AWS Graviton page and you get a number: up to 40% better price-performance than comparable x86 instances. It is on the Graviton cost post too, because it is the whole reason teams migrate. “Up to” marketing numbers measured on someone else’s benchmark are exactly the kind of claim worth checking on a real app before you move production onto it.
So I did. Same benchmark rig as the virtual threads test: Spring PetClinic on real AWS hardware, driven by k6, database kept off the box under test. The only variable is the CPU vendor.
The methodology trap (the reason most vendor benchmarks are worthless)
Vanilla PetClinic is a tiny CRUD app. Put it under load and it bottlenecks on the database or the load generator, not the CPU. Measure that and you are comparing Postgres or your network, not silicon, and the whole post is invalid.
So the setup isolates the CPU:
- Database off the instance under test. Postgres on a separate, identical RDS
box (
db.m7i.large), the same for every vendor, and the driven endpoints do not touch it. - Drive a CPU-bound path. Two endpoints: a synthetic hash loop (
/api/cpu, the per-core floor) and a real one (/api/render?rows=400) that exercises the actual Spring MVC plus Jackson JSON serialization path, no DB. - Verify the CPU is the bottleneck. App CPU pegged at 200 to 202% of the 2 vCPU on every vendor during every run, while DB and load generator sat well below saturation. 0 errors across 180 runs.
- One image, identical bytecode. A single JDK 25 fat jar, built into a
multi-arch container (
linux/amd64+linux/arm64) from one Dockerfile, so Intel, AMD, and Graviton all run the same app.
Concurrency swept 1 to 200, 45 seconds per level, 5 runs per config, median
reported. The compute ran in eu-central-1, but throughput is a property of the
silicon, not the region: the same instance type is the same hardware everywhere.
So I normalize cost by the us-east-1 on-demand rate, the canonical reference
region most teams price against: Intel c7i $0.08925, AMD c7a $0.10264,
Graviton3 c7g $0.07250 per hour. (Price ratios barely move across regions, so
the price-performance verdict is region-independent regardless.)
The headline: requests per second per dollar
This is the chart that matters. Throughput normalized by what you actually pay per hour.
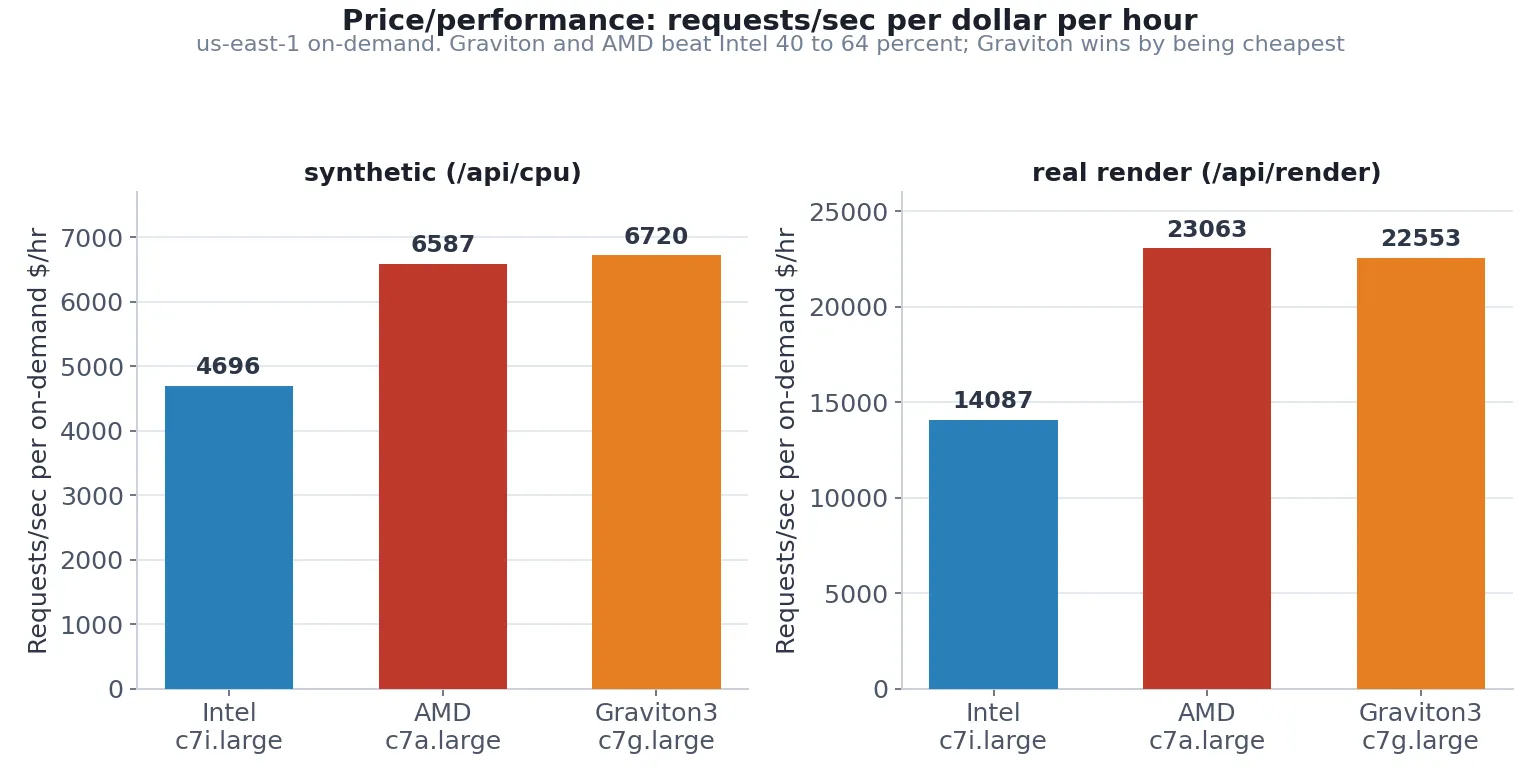
| Endpoint | Intel c7i | AMD c7a | Graviton3 c7g |
|---|---|---|---|
| synthetic (req/s per $/hr) | 4,696 | 6,587 (+40%) | 6,720 (+43%) |
| real render (req/s per $/hr) | 14,087 | 23,063 (+64%) | 22,553 (+60%) |
| cost per million render req | $0.0197 | $0.0120 | $0.0123 |
Graviton3 beat AWS’s marketed “up to 40%” on this workload: +43% on the synthetic floor, +60% on the real render path, both versus Intel. AMD lands in the same place per dollar (+40% / +64%). On the real path, a million requests cost $0.0197 on Intel and about $0.012 on either Graviton or AMD, roughly a 39% cost cut for the same served traffic.
The twist: same vCPU is not the same cores
Here is the part every “Graviton is faster” post skips, and it changes how you read the numbers above. On AWS a vCPU is not a consistent unit, and this is not my inference, it is in AWS’s own CPU-options specification for these exact instances:
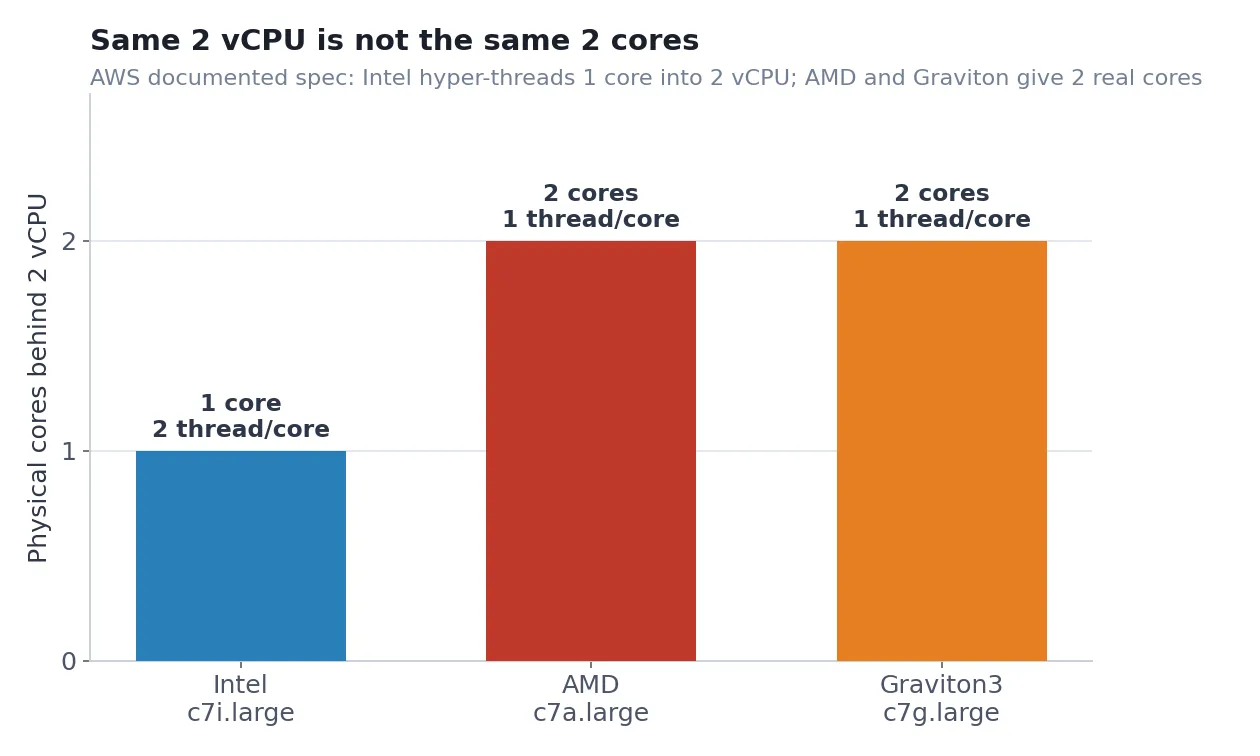
c7i.large(Intel): 1 CPU core, 2 threads per core. Hyper-threading, so 2 vCPU = 1 physical core.c7a.large(AMD): 2 CPU cores, 1 thread per core. No SMT, so 2 vCPU = 2 physical cores.c7g.large(Graviton3): 2 CPU cores, 1 thread per core. No SMT, so 2 vCPU = 2 physical cores.
So the Intel box is doing this benchmark on a single physical core split into two hyper-threads, while AMD and Graviton each have two full cores. Most of Intel’s price-performance deficit is core count, not slow silicon. Per physical core it is competitive, which the single-request numbers below confirm.
Our throughput did scale in a way consistent with that (Intel gained the least going from one request to saturation, AMD and Graviton more), but I want to be precise about what proves what: the core counts are the documented AWS spec, not something I derived from the scaling curve. A 1-to-peak scaling ratio is a messy proxy because a single request does not fully saturate a core, so I am leaning on the spec, not the curve.
That does not make the comparison unfair. You rent and pay per vCPU-hour, so per-vCPU price-performance is the real economic number, and by that measure Graviton and AMD genuinely win. But the mechanism has to be stated, or the post would imply Graviton’s cores are faster than Intel’s. They are not.
What each vendor is actually good at
Splitting speed from price makes the picture honest:
- Graviton wins price-performance by being cheapest, not fastest. It is the weakest per core (single-request p50 was 4.3 ms synthetic, 5% slower than Intel’s 4.1 ms), but it gives you two real cores at the lowest price per hour. That combination is what wins the dollar math.
- AMD wins raw speed. Fastest single core (3.4 ms synthetic, 17% faster than Intel) and two real cores, so it took the top raw throughput on both paths (676 and 2367 RPS). But it is the priciest per hour, which drops it to a tie with Graviton per dollar.
- Intel trails per vCPU mostly because of SMT, not because its core is slow. On a per-physical-core basis it holds up.
The catch: tail latency does not follow the price win
Price-performance is not the only axis, and the tail is where the cheap throughput gets complicated. Comparing p99 fairly means comparing it at the same load, so here it is at a matched 100 concurrent requests on both paths.
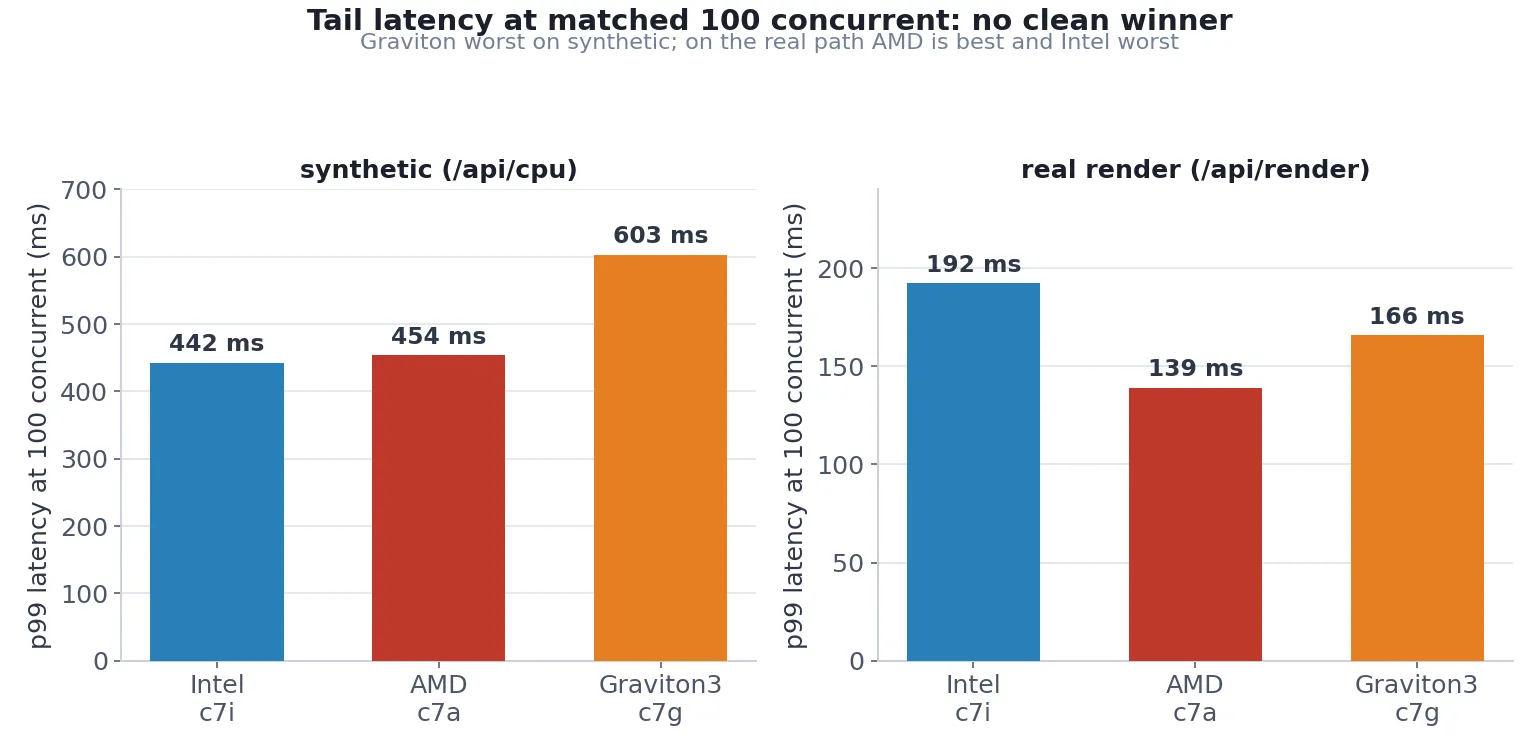
There is no clean winner, and it cuts against the throughput story:
- On the synthetic CPU path, Graviton’s p99 was the worst by a clear margin, 603 ms against about 450 ms for Intel and AMD.
- On the real render path the order flips: AMD was best at 139 ms, Graviton middle at 166 ms, and Intel was worst at 192 ms, despite Intel winning the single-request latency at low load.
The honest read is that Graviton bought you the cheapest throughput but not the best tail, and on the most CPU-bound work its p99 was the worst of the three. If you have a strict tail-latency SLO, measure it on your own workload before you assume the price win is free. Cheap requests per second and a predictable p99 are not the same thing.
Honest caveats
c7.largeonly, one size, one region. Bigger instances with more full cores may shift the SMT effect. This is the 2 vCPU story.- JIT JVM only. A GraalVM native-image axis across all three vendors is the planned follow-up, which ties back to the JVM vs native benchmark. These numbers are the warm JVM.
- CPU-bound by construction. I forced the app tier to be the bottleneck. A DB-bound or IO-bound service will show a different, usually smaller, spread, because the CPU is no longer what you are paying to saturate.
- Prices move. Per-hour rates are us-east-1 on-demand list prices; check current pricing for your region before you commit a number.
- ARM compatibility is the real-world risk, and here it was a non-issue because the stack is all JVM. If you have native dependencies, x86-only base images, or compiled extensions, that migration cost is real and separate from these numbers.
The takeaway
AWS’s “up to 40% better price-performance” held up and then some on a real Spring app: +43% synthetic, +60% on the real path. But the reason is not exotic ARM speed. Graviton gives you two real cores at the lowest price per hour, and that is the whole story. AMD matches it per dollar and is faster in absolute terms; Intel’s deficit is mostly hyper-threading, not weak cores. If your stack is JVM or otherwise ARM-clean and you do not have a tight tail-latency SLO, Graviton is the default that quietly cuts the bill. If you do care about p99, measure it first.
Full source, the multi-arch Dockerfile, the k6 workload, and the Terraform that stands up all three vendors and tears them down live in the repo.
Repo: https://github.com/xp-vit/spring-petclinic
Paying for compute you have not benchmarked across vendors? Moving a JVM service to Graviton is often a 20 to 40% line-item cut for a day of work. Book a free 30-minute call and I will tell you whether your stack moves cleanly. The deeper work is Performance Engineering.