 Viktar Patotski ·
· Performance
· 13 min read
Viktar Patotski ·
· Performance
· 13 min read
Virtual Threads vs Platform Threads: A Spring Boot Benchmark on AWS
Do Java virtual threads make a Spring Boot app faster? I load-tested the same app both ways on real AWS hardware. The honest answer: below saturation they do nothing, on CPU-bound work they do nothing, and where they win on blocking I/O, a properly tuned platform pool matches the throughput. The real case for virtual threads is not raw speed, it is having no pool to tune and a cheaper thread.
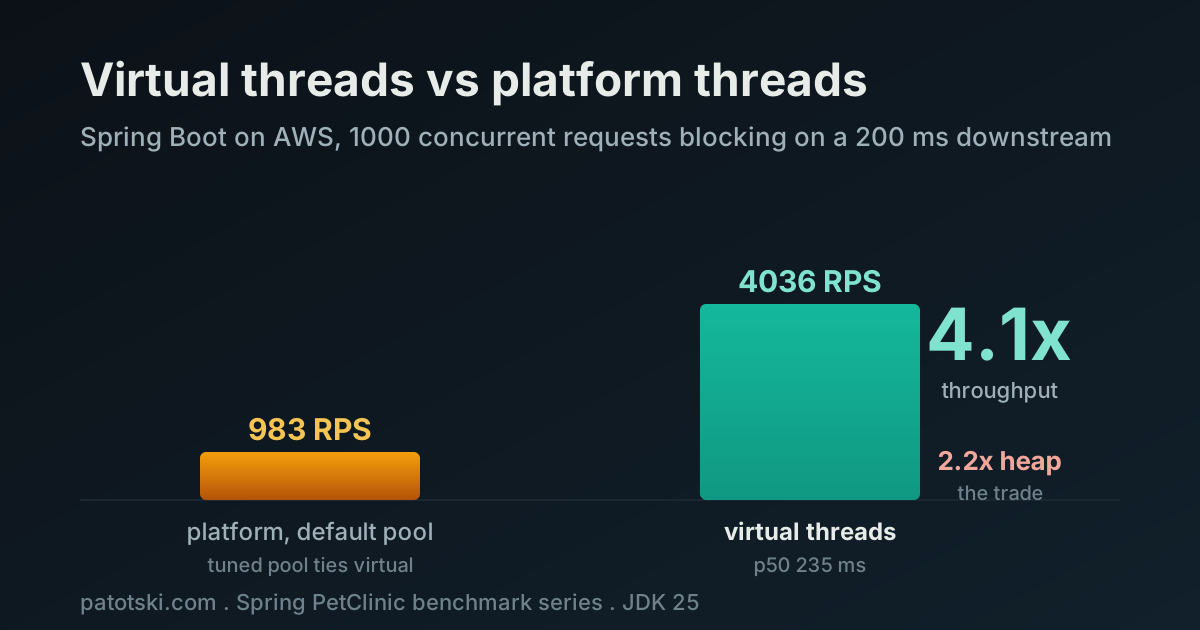
TL;DR - Same Spring Boot app, same AWS box, one config flag flipped (
spring.threads.virtual.enabled). Blocking downstream call, 200 ms, no DB.
- Below ~200 concurrency: identical. Requests fit inside Tomcat’s default 200-thread pool, nothing queues, virtual threads add nothing.
- At 1000 concurrent: 4.1x the throughput (4036 vs 983 RPS) versus the default pool, with latency staying near the 200 ms of real work.
- But that gap is a tuning gap, not a thread-model gap. Raise the platform pool to match the load and it ties virtual almost exactly (4851 vs 4843 RPS). “Just add threads” works for throughput.
- So the real win is operational, not raw speed: virtual threads self-scale (no pool number to pick) and cost less per thread (~135 KB committed stack, not the mythical 1 MB).
- On CPU-bound work: zero benefit. Both modes hit the 2 vCPU ceiling.
- For DB-bound work the connection pool becomes the new ceiling (pool 10 to 100 gave a 10x lift, same threads).
- The concurrency costs memory: virtual used 2.2x the heap of the default pool because it keeps every in-flight request genuinely live.
Virtual threads are for blocking I/O at high concurrency on a modern JDK. The reason to reach for them is simpler operations, not a faster number.
The question
“Turn on virtual threads and your app gets faster” is the version of Project Loom that made the rounds. It is true in exactly one regime, false or irrelevant in several others, and even where it looks true a tuned platform pool often matches it. The difference is worth real money when you are sizing instances.
So I ran it. Same benchmark rig I used for the JVM vs GraalVM native comparison: the canonical Spring PetClinic app on real AWS hardware, driven by k6, with the thread model as the only variable. The goal was the honest “it depends,” backed by numbers, not “virtual threads are always faster.”
Why plain PetClinic would show nothing
This is the part most virtual-thread demos get wrong, so it is worth being explicit. Virtual threads only pay off when request threads spend a long time blocked, long enough to exhaust Tomcat’s default 200-thread pool. A virtual thread that blocks unmounts from its carrier and frees it for other work; a platform thread that blocks just sits there holding an OS thread.
PetClinic’s normal CRUD hits a fast database in well under a millisecond. The pool never saturates, so there is nothing for virtual threads to fix. Even a network-distant RDS query is single-digit milliseconds (still too fast), and a genuinely slow query would hit the JDBC connection pool limit long before the thread limit.
So I injected the blocking on a non-DB path: a co-located async HTTP stub with a
fixed 200 ms delay, a stand-in for a slow external API, called with a
blocking RestClient. The stub is async on purpose. A thread-per-request stub
would saturate before the app did, and then I would be benchmarking the stub.
Same app code both modes, only the flag flips:
@RestController
class SlowController {

    private final RestClient client = RestClient.create();

    // Blocks for ~200 ms on a downstream call. No database involved.
    @GetMapping("/api/slow")
    String slow(@RequestParam(defaultValue = "200") int ms) {
        return client.get()
                .uri("http://localhost:8081/wait?ms={ms}", ms)
                .retrieve()
                .body(String.class);
    }
}
# The one line that is the whole experiment. Config, not code.
spring.threads.virtual.enabled=trueSetup and reproducibility
- Spring PetClinic, Spring Boot 4.0.3, JDK Amazon Corretto 25.0.3.
- Load generator: k6. Each concurrency level is a separate closed-loop run (virtual users == concurrency, no think-time), measured at steady state after warmup, so the percentiles are steady-state and not smeared across a ramp.
- AWS: app on c7i.large (2 vCPU, 4 GB) with the stub co-located on localhost; k6 on its own c5.large; Postgres on RDS db.m7i.large (only touched by the DB endpoint). Terraform tears it all down at the end.
- Endpoints, all profile-gated and identical across both modes:
GET /api/slow?ms=200- blocking downstream, no DB (the clean crossover)GET /api/slow-db?ms=200- the same call while holding a pooled DB connection in a transaction (the connection-pool story)GET /api/cpu?iters=N- pure CPU work, no blocking (the “does not help” case)GET /api/threadstats- live platform thread count viaThreadMXBean, so I can actually see the 200-thread cap being hit.
- Every result was checked against physics before I trusted it: throughput
should equal
concurrency / latencywhile unsaturated, andpool / hold timeonce saturated. It does, which is how I caught the numbers that did not.
Result 1: the crossover (vs the default pool)
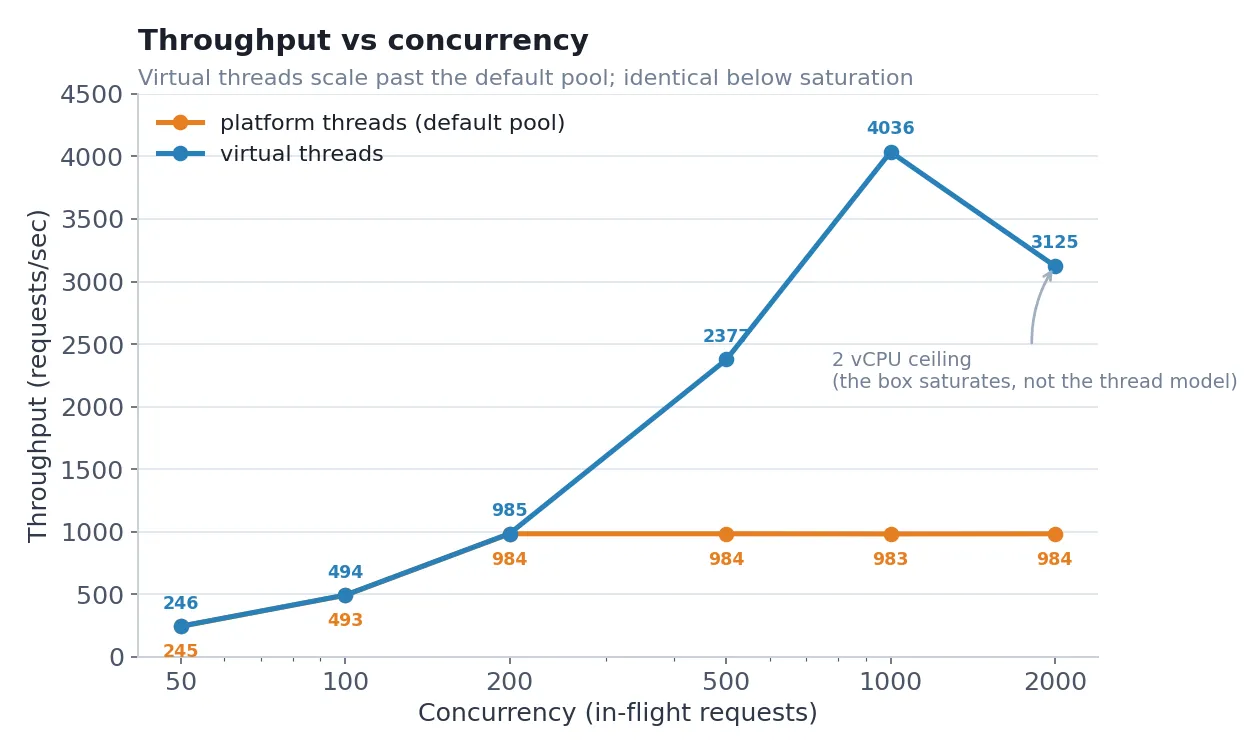
Throughput and median latency on /api/slow, default-pool platform threads vs
virtual, as concurrency climbs. “Threads” is the live OS-level platform thread
count sampled during the run.
| Concurrency | Platform RPS / p50 (ms) | Virtual RPS / p50 (ms) | Plat threads | Virt threads |
|---|---|---|---|---|
| 50 | 245 / 202 | 246 / 202 | 122 | 48 |
| 100 | 493 / 202 | 494 / 202 | 148 | 51 |
| 200 | 984 / 202 | 985 / 202 | 256 | 63 |
| 500 | 984 / 509 | 2377 / 206 | 267 | 99 |
| 1000 | 983 / 1014 | 4036 / 235 | 267 | 142 |
| 2000 | 984 / 2031 | 3125 / 301 | 266 | 162 |
Below about 200 concurrency, the two are identical. Every request fits inside the 200-thread budget, nobody queues, and virtual threads change nothing. This is the honest no-benefit zone, and it is where a lot of apps actually live.
The default platform pool tops out at ~983 RPS, dead flat from c200 to c2000. Once all 200 Tomcat workers are busy waiting on the 200 ms downstream, extra load just queues. Latency grows in lockstep with concurrency (202, then 509, then 1014, then 2031 ms) while throughput does not move. Peak platform threads pin at ~266 (200 workers plus JVM internals). Textbook pool saturation.
Virtual threads scale past it: 2.4x at c500, 4.1x at c1000 (4036 vs 983 RPS), with latency staying near the 200 ms of real work. Peak platform threads stay between 48 and 162, because a waiting virtual thread is not holding an OS thread.
Hold onto the word “default” there. That 4.1x is against Tomcat’s out-of-the-box 200 threads. Result 5 asks the obvious follow-up: what if you just raise the pool?
The c2000 virtual number dips to 3125, below its own c1000 result, with a 60 second worst-case outlier and a 0.5% error rate. That is a hardware ceiling, not a thread-model failure: at 2000 concurrent, the 2 vCPU app sharing its two cores with the co-located stub runs out of CPU for connection handling, scheduling, and GC. A bigger box, or moving the stub off the app node, would push the knee out further. It is not “virtual threads getting slower,” and I am calling it out so nobody quotes it that way.
Result 2: the connection pool becomes the new ceiling
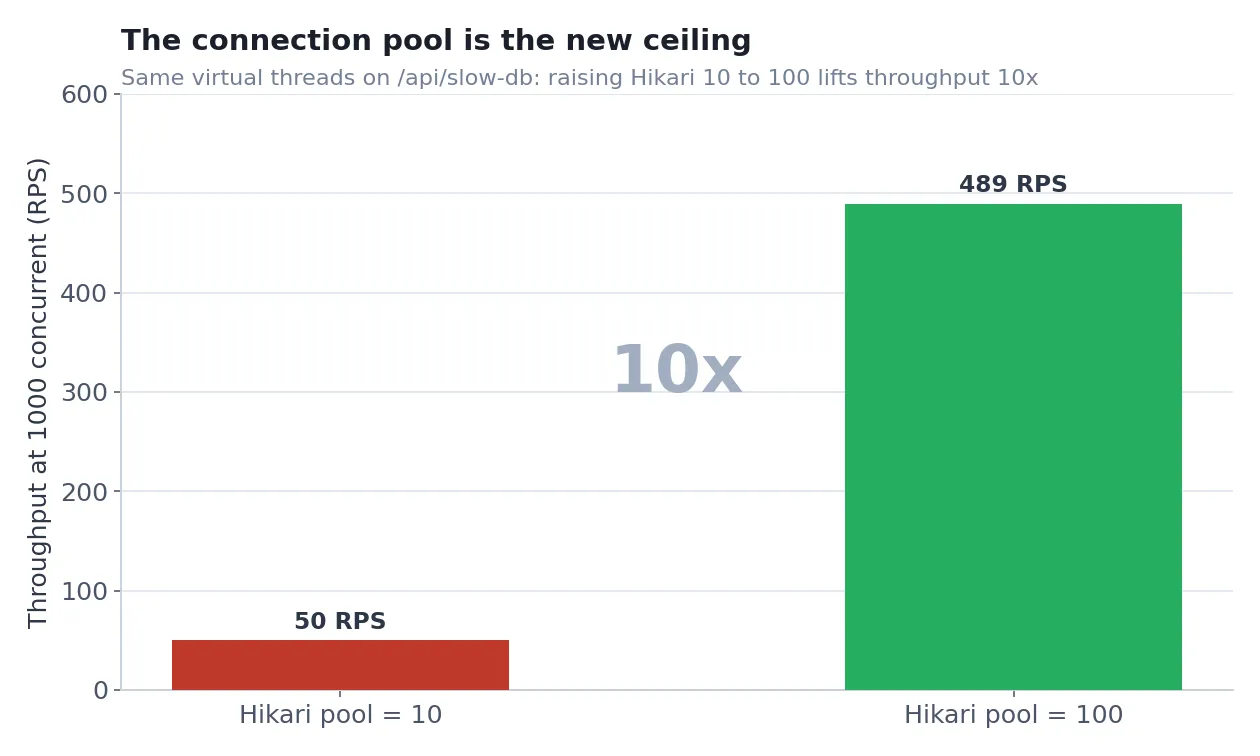
Now the same 200 ms call, but made while holding a pooled DB connection inside a
transaction (/api/slow-db). Both runs use virtual threads. The only thing
that changes is HikariCP’s maximum-pool-size.
| Concurrency | Pool = 10 (RPS / p50 ms) | Pool = 100 (RPS / p50 ms) |
|---|---|---|
| 50 | 49 / 1024 | 242 / 204 |
| 200 | 49 / 4075 | 490 / 406 |
| 500 | 49 / 10169 | 490 / 1015 |
| 1000 | 50 / 20144 | 489 / 2030 |
| 2000 | 61 / 29829 | 487 / 4065 |
With pool = 10, throughput pins at ~49 RPS at every concurrency level. That
is exactly pool size / hold time = 10 / 0.2s = 50. Latency climbs to 30
seconds because thousands of virtual threads are all queued waiting for one of
10 connections. The threads are free; the connections are not.
Raise the pool to 100 and throughput jumps 10x, to ~490 RPS. Same thread model, same code, one config value. The lesson is the one that matters most in production: cheap threads move the bottleneck, they do not remove it. Flip on virtual threads and your next constraint is very often the database connection pool, which is a separate thing you have to size deliberately. If you want the longer version of that story, it is the same reasoning behind the database scaling ladder.
Result 3: when virtual threads do nothing
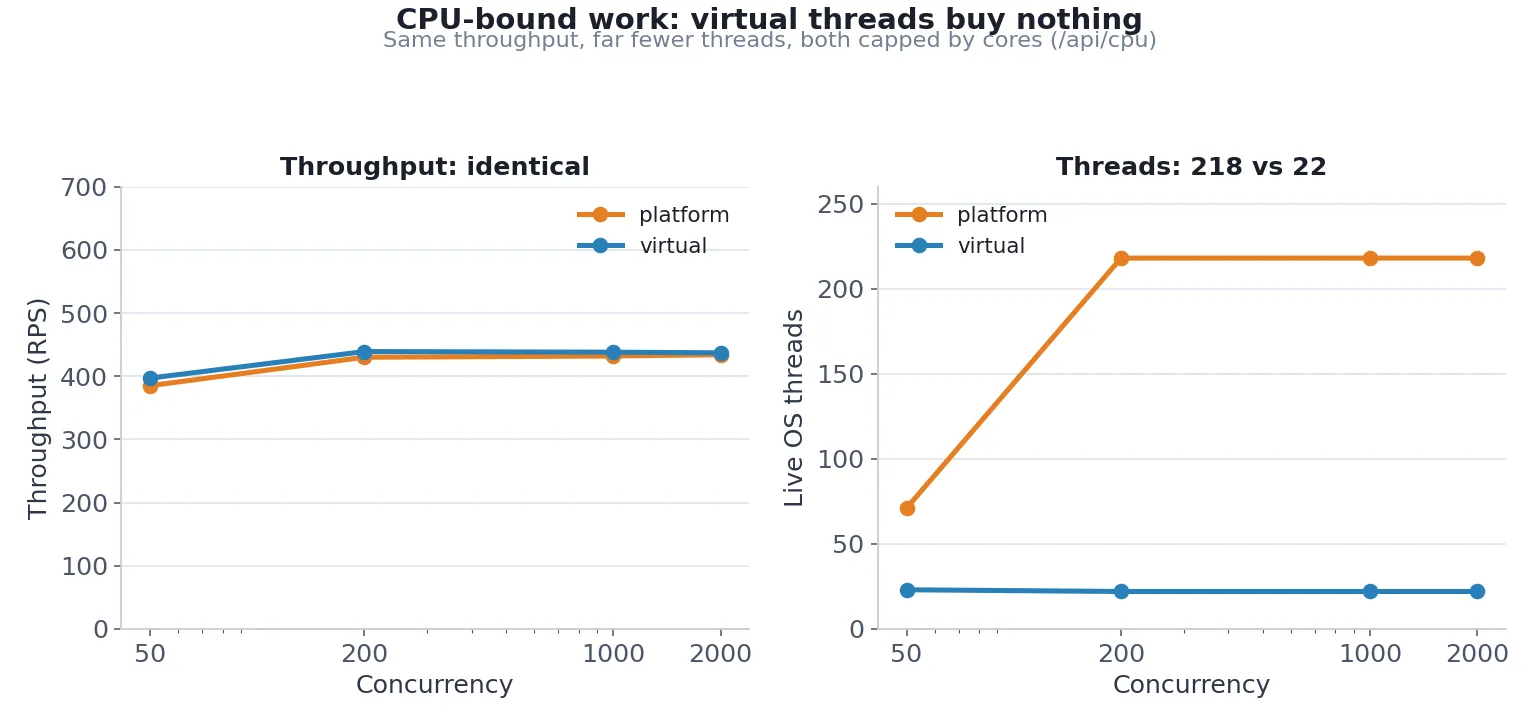
Pure CPU work, no blocking (/api/cpu).
| Concurrency | Platform RPS / p50 (ms) | Virtual RPS / p50 (ms) | Plat threads | Virt threads |
|---|---|---|---|---|
| 50 | 385 / 121 | 397 / 113 | 71 | 23 |
| 200 | 430 / 437 | 439 / 450 | 218 | 22 |
| 1000 | 432 / 2210 | 438 / 2270 | 218 | 22 |
| 2000 | 434 / 4536 | 437 / 4531 | 218 | 22 |
Both modes plateau at ~435 RPS, the 2 vCPU ceiling for this work. The bottleneck is cores, not threads, so making threads cheaper changes nothing. Virtual gets there with 22 live threads instead of 218, which confirms the work is CPU-bound, and it even shows occasionally worse tail latency under CPU saturation (a 52 second max at c500) because there is scheduling overhead with nothing to unmount for. Do not reach for virtual threads on CPU-bound paths.
Result 4: the concurrency is paid for in heap
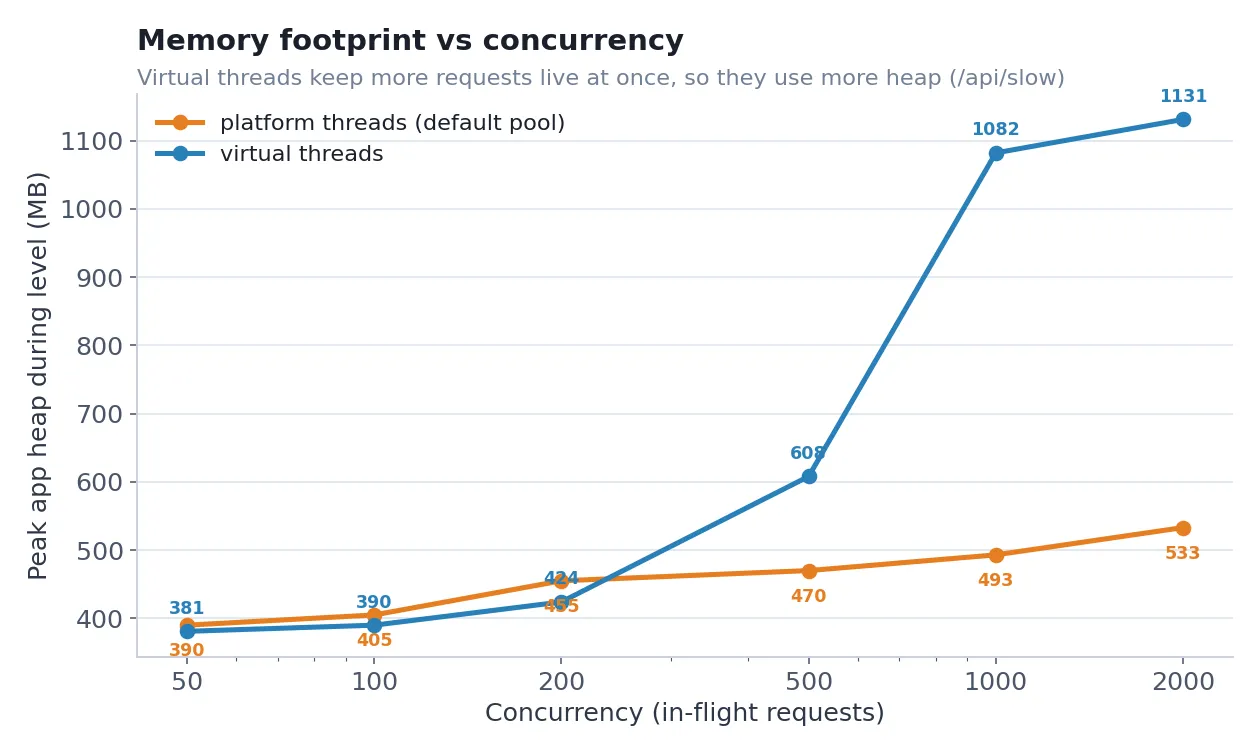
Peak app-container heap during each concurrency level on /api/slow:
| Concurrency | Platform peak MB / avg CPU | Virtual peak MB / avg CPU |
|---|---|---|
| 50 | 390 / 34% | 381 / 36% |
| 200 | 455 / 38% | 424 / 38% |
| 500 | 470 / 39% | 608 / 73% |
| 1000 | 493 / 36% | 1082 / 117% |
| 2000 | 533 / 35% | 1131 / 101% |
(CPU is a percentage of 200%, since the box has 2 vCPU.)
The memory lines diverge at the same point the throughput lines do, around c200. Below saturation they are the same. Above it they split hard.
The default platform pool stays flat past c200 because it only ever keeps ~200 requests live at once. The other 1800 queue at the acceptor holding no request state, so more load does not mean more heap.
Virtual climbs to 2.2x (1082 vs 493 MB at c1000) because it keeps all ~4000 requests genuinely in flight, each holding a stack, a downstream connection, and buffers. That is not waste, it is the mechanism: the throughput exists precisely because every request is really being worked on at once, and that costs memory. The CPU numbers say the same thing from the other side. The default pool idles at ~35% (its threads are blocked behind the 200 cap), while virtual runs at 100% plus because it is actually doing about 4x the work.
The practical consequence: budget heap for your peak in-flight request count, and put a bulkhead or a semaphore in front of the work so a traffic spike cannot turn “more concurrency” into an out-of-memory kill.
Result 5: the fair fight, “just add platform threads”
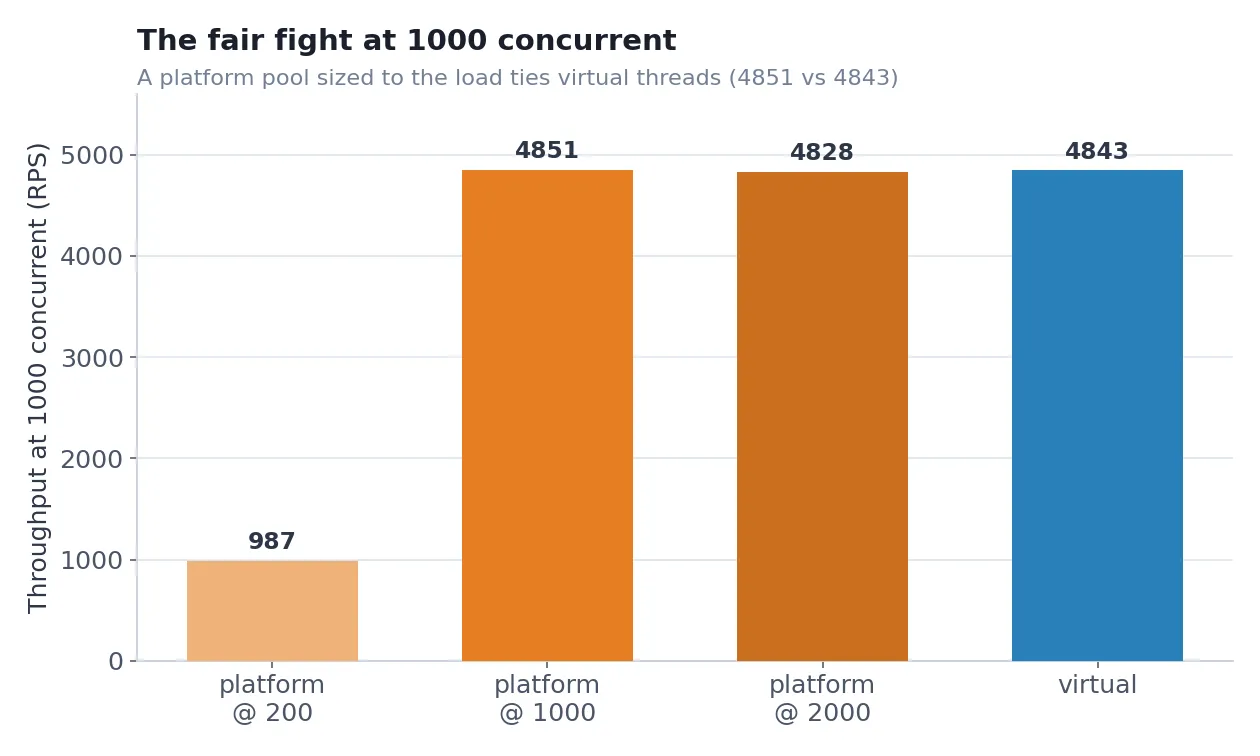
Comparing virtual against a default 200-thread pool is a strawman, and I did
not want to publish one. So I raised Tomcat’s threads.max to 1000 and 2000 and
re-ran /api/slow. (This sweep ran locally on a 2 vCPU / 3 GB cap, since it only
needs the pool-sizing mechanism, not the cloud.)
| Config | c1000 RPS / p50 (ms) | c2000 RPS / p50 (ms) | Heap @ c1000 |
|---|---|---|---|
| platform @ 200 | 987 / 1007 | 984 / 2018 | 597 MB |
| platform @ 1000 | 4851 / 202 | 4832 / 403 | 914 MB |
| platform @ 2000 | 4828 / 202 | 2402 / 205 | 910 MB |
| virtual | 4843 / 202 | 2429 / 204 | 779 MB |
Sizing the pool to the load closes the throughput gap completely. Platform
at 1000 threads ties virtual at c1000 almost to the request: 4851 vs 4843 RPS,
both at a 202 ms median. For pure blocking work, threads roughly equal to concurrency buys you the same throughput virtual threads do. The “just add
threads” reflex is not wrong.
The gap does not vanish, though. It moves, into three costs:
- More memory at equal throughput. Platform at 1000 threads used 914 MB against virtual’s 779 MB at c1000, about 135 MB more in native thread stacks. Worth correcting a myth here, one an earlier draft of my own notes got wrong: platform threads are quoted at “~1 MB each,” but that is reserved address space, not committed memory. Measured, an idle blocked stack commits about 135 KB, so 1000 threads cost ~135 MB, roughly 7x less than the 1 MB figure implies. The per-thread penalty is real but much smaller than folklore says.
- You have to pick the number, and it is workload-specific. Platform at 1000 re-saturates at c2000 (median doubles to 403 ms). Platform at 2000 fixes that but wastes memory at low load and falls off a cliff at c2000 anyway. Virtual self-scales, there is no number to tune.
- Threads cannot buy cores. At c2000 every mode collapses toward ~2400 RPS, the 2 vCPU wall. No thread model gets past the hardware.
So the honest pitch for virtual threads is not “faster.” A tuned platform pool matches the throughput. It is operational: you delete a tuning knob (no pool size to guess and re-guess as load changes) and you pay less per thread. That is a real benefit. It is just a different benefit from the one the headlines sell.
The pinning trap, and why it is mostly gone
A virtual thread that blocks while pinned to its carrier cannot unmount, and
it stalls that carrier. Before JDK 24, blocking inside a synchronized block
pinned the carrier, and enough of them would quietly collapse virtual threads
back to platform behavior with none of the benefit. This is the classic Loom
footgun.
On JDK 24 and 25 (Corretto 25 here) the object monitor was reworked and this is
largely fixed, which is why I did not build a pinned variant. It would
demonstrate a non-event on a current JDK. If you are on an older runtime and
want to check your own stack, run with -Djdk.tracePinnedThreads=full to log a
trace on each pinning event, or use the JFR jdk.VirtualThreadPinned event. The
usual culprits are synchronized around I/O (switch to a ReentrantLock) and
blocking native calls.
The honest caveats
- Virtual threads change the throughput picture only in the blocking plus high-concurrency regime, and even there a tuned platform pool matches them. Zero effect below thread saturation, zero for CPU-bound work. All measured above, not asserted.
- The c2000 virtual dip is a 2 vCPU hardware ceiling (app plus co-located stub on two cores), not a Loom regression.
- Single app node, and the stub is on localhost, so there is no real network hop to the downstream. The injected 200 ms is the latency. That is the right setup for isolating the thread story, but it is not a network study.
- The fair-fight sweep ran locally on a 2 vCPU / 3 GB cap rather than on AWS, because pool sizing is a mechanism that does not need cloud hardware to show.
- Numbers are steady-state per level. The RDS box is only touched by the DB endpoint.
The decision rule
Turn virtual threads on when your requests spend most of their time blocked on I/O, you run at high enough concurrency to saturate the thread pool, and you are on a modern JDK. Do it for the operational win: no pool size to tune as load shifts, and a cheaper thread. Do not do it expecting a number a tuned platform pool could not also hit, because it can. And once threads are cheap, go size the constraint that is actually left, which is almost always your downstream connection pools and your heap.
Outside that regime, below saturation or on CPU-bound work, virtual threads are neutral at best and carry a small tail-latency and memory cost at worst.
Full source, the k6 workload, the async stub, and the Terraform that stands the whole thing up and tears it down again live in the repo.
Repo: https://github.com/xp-vit/spring-petclinic
Running a Spring Boot service that is starting to queue under load? Book a free 30-minute call and I will look at whether virtual threads, pool sizing, or something else entirely is your actual ceiling. This is the kind of thing I dig into in Performance Engineering.