 Viktar Patotski ·
· performance
· 6 min read
Viktar Patotski ·
· performance
· 6 min read
MapStruct vs ModelMapper vs Orika: I Measured the Mapping Tax
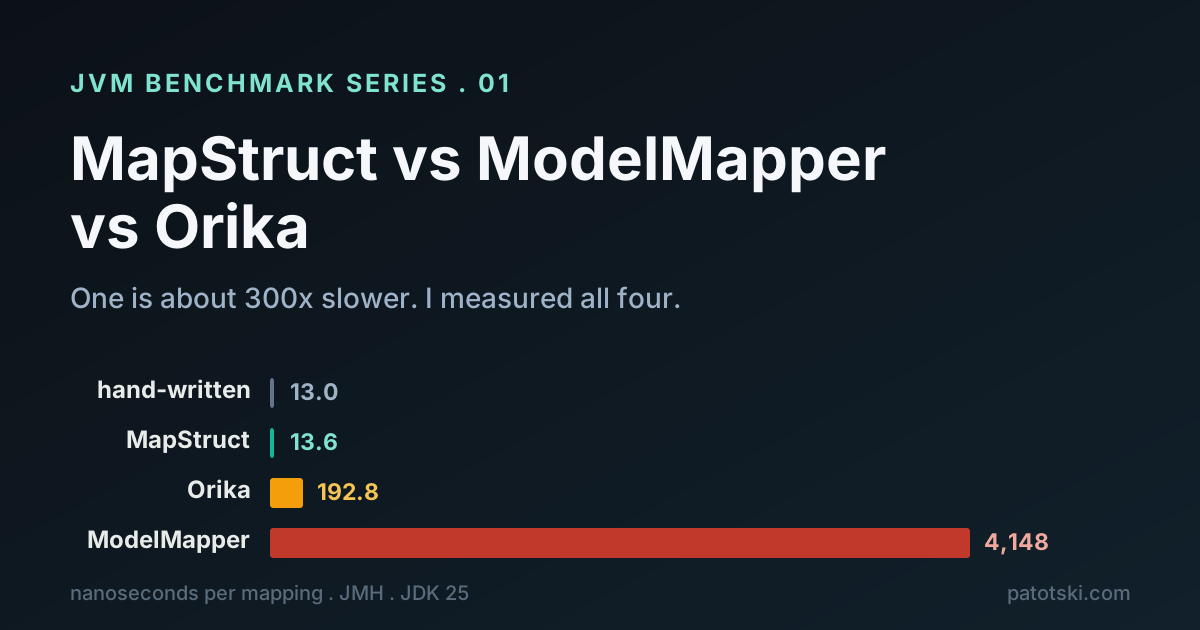
Four ways to map a Java bean, one JMH harness, real numbers. MapStruct costs almost nothing over hand-written code. One of the others is about 300x slower. Here is which, and when it matters.
Every Java service that talks to the outside world maps beans: entity to DTO, DTO
to response, request to command. You can do it by hand, or reach for a library so
you stop writing dto.setX(source.getX()) forty times. The usual three are
MapStruct, ModelMapper, and Orika. They feel interchangeable in a code review.
They are not. Under load the gap between them is about 300x, and it comes straight
from how each one does its job.
So I benchmarked all three, plus a hand-written mapper as the control, with JMH. Same object, same machine, real numbers.
The contenders
MapStruct is a compile-time annotation processor. You declare a @Mapper
interface, and at build time it generates the plain, boring Java you would have
written by hand (PersonMapperImpl with a pile of getters and setters). At run
time there is no library doing anything clever, just generated code.
ModelMapper works at run time by reflection. You hand it a source and a target class and it matches fields by convention. Zero build-time setup, very little code, but every mapping call inspects the objects through the reflection API.
Orika also works at run time, but generates bytecode (via Javassist) for each mapping instead of reflecting on every call. In theory that should land between the other two. One catch up front: Orika is unmaintained. Its last release, 1.5.4, was February 2019, and it shows (more on that below).
Hand-written is the control: plain Java, no library. It is the floor. The only honest way to read “fast” is against the cost of doing it yourself.
How I measured
JMH, the standard Java microbenchmark harness.
AverageTime mode, nanoseconds per mapping, 5 forks of 5 warmup and 5 measurement
iterations (25 samples per mapper), one thread, with the GC profiler on so allocation
per call is measured alongside time. The mappers are built once in setup, so the
benchmark measures steady-state mapping cost, not configuration.
The fixture is not a toy two-field DTO, because that would flatter everything. It
is a Person with 11 fields: a couple of primitives, some strings, a LocalDate,
an Instant, a nested Address object, and a list of roles, mapped to a matching
PersonDto. Hardware and versions are disclosed because reproducibility is the
point: AMD Ryzen 9 7950X3D, 96 GB RAM, Amazon Corretto JDK 25.0.3, JMH 1.37,
MapStruct 1.6.3, ModelMapper 3.2.6, Orika 1.5.4. The full harness is in the
repo; clone it and run it on your own box.
The numbers
Time to map one object, lower is better:
| Mapper | Approach | ns per mapping | error (ns) | vs hand-written | bytes allocated per mapping |
|---|---|---|---|---|---|
| Hand-written | plain Java | 12.94 | ±0.30 | 1.00x | 176 |
| MapStruct | compile-time codegen | 13.50 | ±0.17 | 1.04x | 176 |
| Orika | runtime bytecode | 174.78 | ±3.40 | 13.5x | 744 |
| ModelMapper | runtime reflection | 4,074.94 | ±52.97 | 315x | 12,560 |
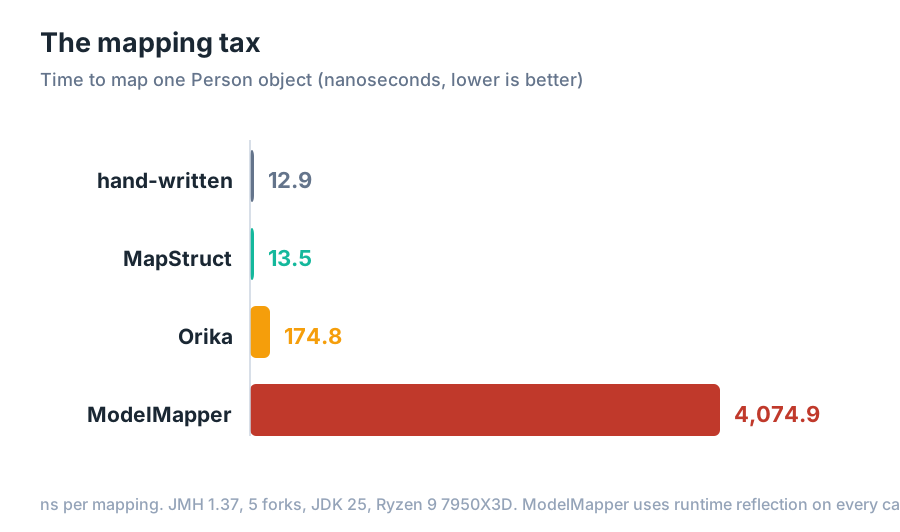
The chart is almost useless at first glance, and that is the point: ModelMapper’s bar is so long the other three are slivers. That is the story. Reflection on every call costs about 4,100 nanoseconds here; the other approaches are in the tens to low hundreds.
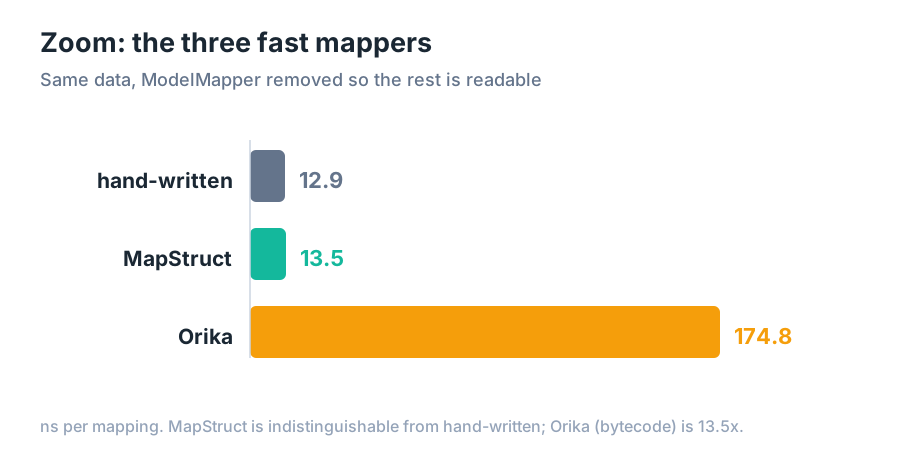
Zoom in on the three fast ones and the rest of the shape appears:
What the numbers mean
MapStruct is indistinguishable from hand-written in practice. 13.5 ns versus 12.9,
a 4% gap that sits inside the noise, and the allocation column settles it: both allocate
exactly 176 bytes per mapping. The generated code creates precisely what you would
create by hand (the DTO, the nested AddressDto, the roles list) and nothing else. That
is the whole argument for it: because the mapping code is generated at compile time,
there is no run-time machinery to pay for, in time or in garbage. You get the
convenience of declaring an interface and the performance of code you wrote yourself.
ModelMapper is about 300x slower than MapStruct, 315x hand-written. It is not broken and it is not badly written; reflection is just expensive, and it pays that cost on every single call. The allocation column says where the time goes: 12,560 bytes per mapping, 71x the floor. The slowdown is allocation-bound, not CPU-bound. The GC data has a telling inversion: ModelMapper shows the lowest allocation rate of the four, 2.9 GB/s against 12 to 13 GB/s for the fast pair, because it is too slow to allocate quickly. For a mapping that runs once per request on a cold path, 4 microseconds is invisible. For one that runs in a loop over a result set, or on a hot request path at scale, it is a real tax you are paying for the convenience of skipping a build step.
Orika lands in the middle at 13.5x, allocating 744 bytes per mapping, 4.2x the
floor. The bytecode-generated mappers are real, but you pay for MapperFacade
dispatch and a per-call context object on top: better than reflection, worse than
generated-at-compile-time code. It is hard to recommend in 2026, and not only on speed.
The Orika catch
Orika did not run at all on JDK 25 until I added a JVM flag:
--add-opens=java.base/java.lang=ALL-UNNAMEDIt reflects into java.lang internals (to clone objects), and the JDK module system
has blocked that by default since JDK 16. A maintained library would have fixed this
years ago. Orika has not shipped a release since 2019, so you inherit the workaround.
The maintained libraries in this test need no such flag. To keep the comparison fair I
applied it to all four benchmarks anyway, so the flag itself introduces no bias. Treat
Orika as a data point about the runtime-bytecode approach, not as a live option for new
code.
The honest verdict
Fastest is not the only axis, so be fair about what the slower libraries buy you. ModelMapper needs no annotation processor and no build-time step, and its convention-based mapping means less code for loose, forgiving transformations. On a cold path where a few microseconds do not matter, that convenience is a legitimate choice.
But if mapping is anywhere near a hot path, the numbers are not close. MapStruct costs almost nothing over writing the mapper by hand, and it catches missing mappings at compile time instead of at run time. For most services it is the right default, and this benchmark is why. Orika is a museum piece. ModelMapper is a convenience you should price before you put it in a loop.
The harness, the fixture, and the raw results are in the jvm-benchmarks repo. Run it on your hardware and check the numbers.
This is the first in a series of JMH library benchmarks. If your team is fighting a performance problem that is less about mapping and more about the whole request path, that is the kind of thing I do under Performance Engineering. Related on this site: Spring Boot on the JVM vs GraalVM Native.